Analyzing DarkComet in Memory
*Note: This article turned out much longer than I originally anticipated. For those who are looking actionable data from this report but don’t want to suffer through the entire article, there are Yara rules at the end!
Overview
In a recent case I came across DarkComet and had the opportunity to test out my new Volatility skills. Over the course of this article I will be using a memory dump from a Windows7 VM that I installed the following sample on:
f6351da84168d40fae8da0c156fbab0f – Downloaded from VirusTotal
If you would like to follow along feel free to Download a practice memdump. Keep in mind that the memdump available for download is from the same piece of malware but from a different machine then I used in the rest of the article, so PIDs won't match up. That should make the memdump a little more fun for you. In the case I was working, all I had was a memory sample and an alert from a network appliance stating that DarkComet communications came from the suspected host. My goal in the investigation was to determine if the host was actually infected, is the infection DarkComet, what was the malware doing, was there any exfiltration, and was this infection used to pivot elsewhere in the network.
Getting started
There are a few different approaches an analyst can take. Some will go research heavy and try to learn what they can about DarkComet before looking at the dump, while others like to dive right in. Me, I live dangerously sometimes, so I dove in without doing much research. I actually like a hybrid approach though. Just like when I get a PCAP I like to get a feel for a memory dump before doing too much research, mainly because I don’t want to subject myself to confirmation bias.
Process analysis
Like always I start off with an imageinfo to get an idea of what profile I should use, but also to understand the timezone of the image. Then I move onto psxview. Running psxview, Volatility will check for processes within the memory dump in various ways. This helps us find suspicious processes even if they try to circumvent analysis via one or multiple standard methods. Using the –A flag with psxview applies rules to help us understand what legitimate processes should show as “False” by replacing “False” with “Okay”.
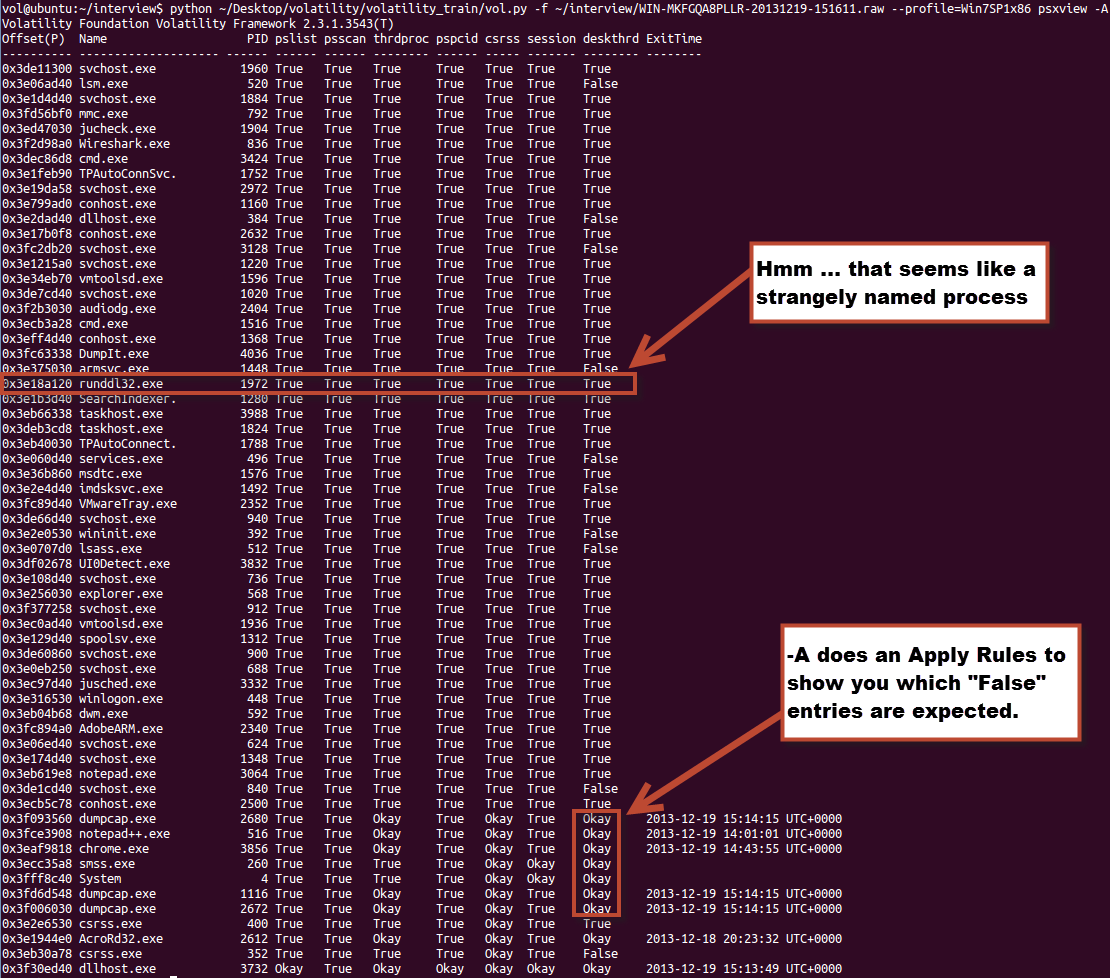
In this case, we didn’t really have to do much analysis to figure out what our bad process probably is. The attackers made it somewhat easy on us by using a common misspelling runddl32.exe. In scenarios where the malware isn’t so obvious we may be looking at loaded dlls, launch times, parents, occurrences, hooks, and paths to find bad processes. So let’s do a dlllist on this guy to find out where it resides.
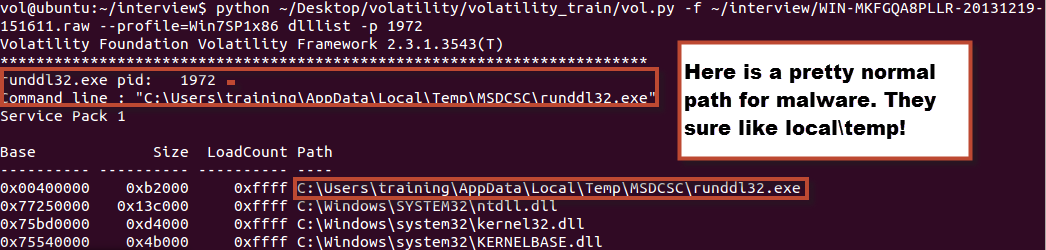
Ahh, no surprise here, as we typically see %APPDATA% paths leveraged by attackers. That gives us something to work from.
*MSDCSC is a common path utilized by DarkComet. Most likely a default path in the builder.
File extraction
Knowing the path we can check if the file is potentially still resident in memory with filescan. In this case it was, so I used dumpfiles to extract it out. In cases where that doesn’t work procexedump may be better suited.

With it extracted we can then do general analysis on it like one of my favorite commands ever: “strings”. I will skip that for this article though as I want to focus more on what is in memory rather than in the file extracted from memory.
Network communications
Now around this time in the actual case I began to take a closer look at the network connections. Unfortunately though, I did not simulate those connections in this memory dump to be able to show you, so we will skip that as well. Keep in mind you would be looking for what external addresses are involved, what ports, and of course when the network connections occurred. I usually feed the network indicators to Automater for OSINT analysis. Additionally, the connections may be a good place to start getting an idea if lateral movement may be occurring. Looking for connections over 445 or 3389 may indicate pivoting, especially when it is two workstations that are involved.
More process analysis
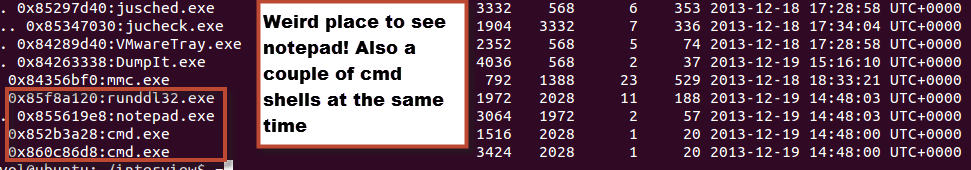
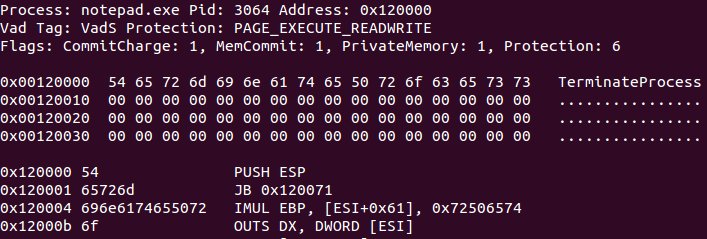
Getting back to the processes, I thought it would be good idea to do a pslist so I could understand what the parent pid was. The parent was no longer around, so I don’t know what did the initial launch, but I do see other processes launched by that same parent. Also, drawing more attention to the process we see notepad.exe launching under runddl32.exe. Usually when I see notepad.exe I will run the notepad plugin in volatility which will show the text of a notepad session. In this case that did not return any results. Using malfind on the notepad process we see that it is probably not doing any notepad like activity anyways.
Find the Mutants!
At this point there is no question that runddl32.exe is not a normal process. So let’s try to identify other indicators. A great place to start if you know the bad process is to look at handles to see what files, mutants, and registry keys may be of interest. To start off with the Mutants aka Mutex objects, there are some pretty apparent indicators.
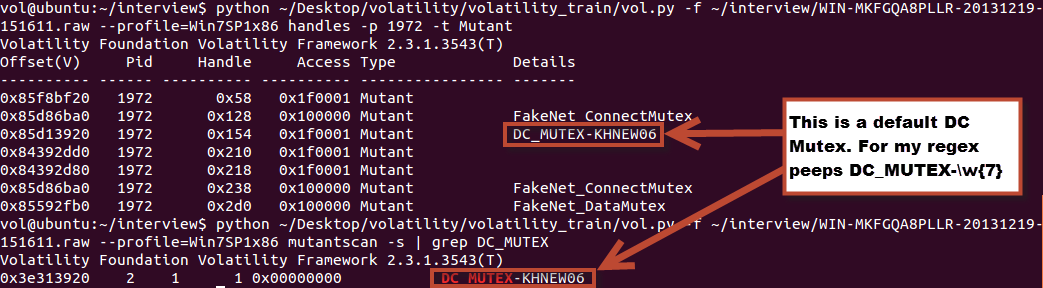
DarkComet has a default mutex of “DC_MUTEX-<7 alphanumeric characters>”. For those who don’t understand what a mutex is, there are plenty of good articles you can read up on, but for the purpose of this discussion think of it as a way a program can let the OS know it is there so it doesn’t get launched again while it is already running.
I looked at a lot of DarkComet samples while trying to test the Yara rules that you will see at the bottom. In that testing here are the unique Mutex objects I saw:
*There are a couple in here that I am not positive were actually DarkComet as I used AV signatures to grab the sample set. As we all know AV can sometimes be misleading.
DarkComet config
We have already learned a lot about this malware, but there are still plenty of other things to know. For instance, did it implement a persistence mechanism, what capabilities does it have, how did it get on the system, and so on. To begin to answer those questions I like to dump out the memory of a process and then run strings against it to start to paint a picture. I ran the following command to generate a memdump of the process (runddl32.exe) itself.
python ~/Desktop/volatility/volatility_train/vol.py -f ~/interview/WIN-MKFGQA8PLLR-20131219-151611.raw --profile=Win7SP1x86 memdump -p 1972 -D.
Now with that I ran strings. Keep in mind that when running strings in Linux you need to use the –a options and you have to run separately for ASCII and UNICODE, which will look something like this:
strings -a 1972.dmp #ASCII
strings -a –e l 1972.dmp #UNICODE
*There are of course other methods that can be leveraged here to combine these commands
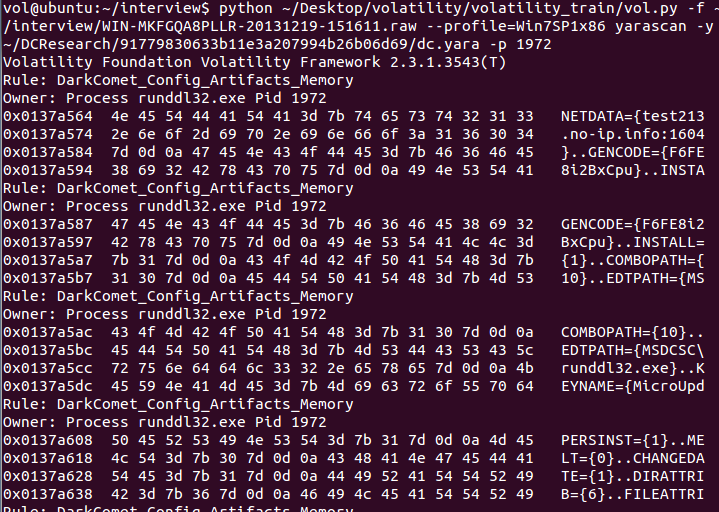
After spending a ton of time looking through these strings, I began to pick out some very obvious data. My favorite of which is the DarkComet configuration:
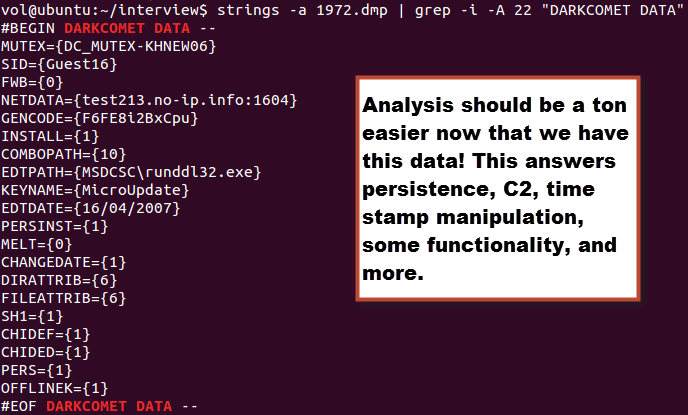
As you can imagine, once I found the DarkComet configuration in memory the case changed a lot for me. To really understand it though I had to do a bit of research to understand what each of these options meant.
Most of the data on these commands came from two places, searching through the posts on hackforums[.]net and and article from Context Information Security (http://contextis.com/research/blog/malware-analysis-dark-comet-rat/)
Some of them are obvious like NETDATA, PERSINT, KEYNAME, etc. Others are not so obvious though, like OFFLINEK which became a very important part of my case. So let’s explain some of these here:
MUTEX={DC_MUTEX-KHNEW06} # This is the Mutant/mutex value that is used
SID={Guest16} # Campaign name
FWB={0} # Firewall bypass (Windows Firewall)
NETDATA={test213.no-ip.info:1604} # C2 *Most seem to be 1604 so that is probably the default
GENCODE={F6FE8i2BxCpu} # Not quite sure on this one, perhaps part of building the encryption?
KEYNAME={MicroUpdate} # Registry key name
EDTDATE={16/04/2007} # Used for time stamp manipulation
PERSINST={1} # Persistence
MELT={0} # Delete the original executable or not
CHANGEDATE={1} # Use the EDTDATE to modify the $SI timestamps
DIRATTRIB={6} # Modify the attributes of a directory, such as make it hidden
FILEATTRIB={6} # Modify the attributes of a file, such as make it hidden
OFFLINEK={1} # Offline keylogging
So as you can tell, I didn’t find out what each option does, but enough to get by for now. If I was really interested in knowing each possible option and what it means, I would take the time to get the latest version of the builder and try out each option to determine what the config changed too. Now this sample's configuration differs slightly from the sample I had for the case, but the general strokes are the same.
Keylogger
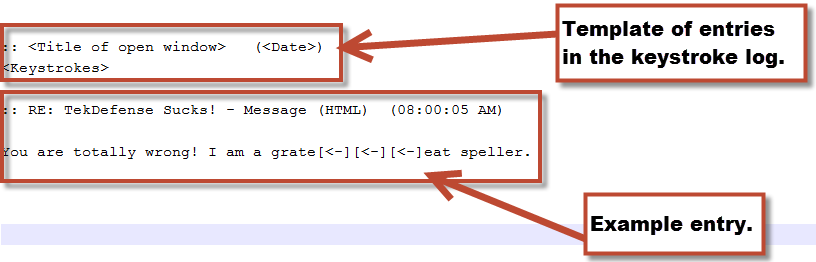
The OFFLINEK option had me confused for a bit. So to explain it a bit better, when OFFLINEK is enabled “{1}” the malware will continue to log keystroke to a local file that can then be picked up by the attacker as they want. When disabled, the attacker only has access to keystrokes when the attacker has a live session open with the victim. Looking through the strings memdump in my case quickly showed artifacts that were indicative of a keylogger such as “[<-]” and the titles of open windows like outlook emails. Strings also showed a path that seemed somewhat suspicious as well.
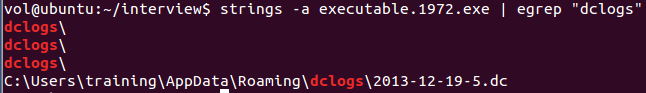
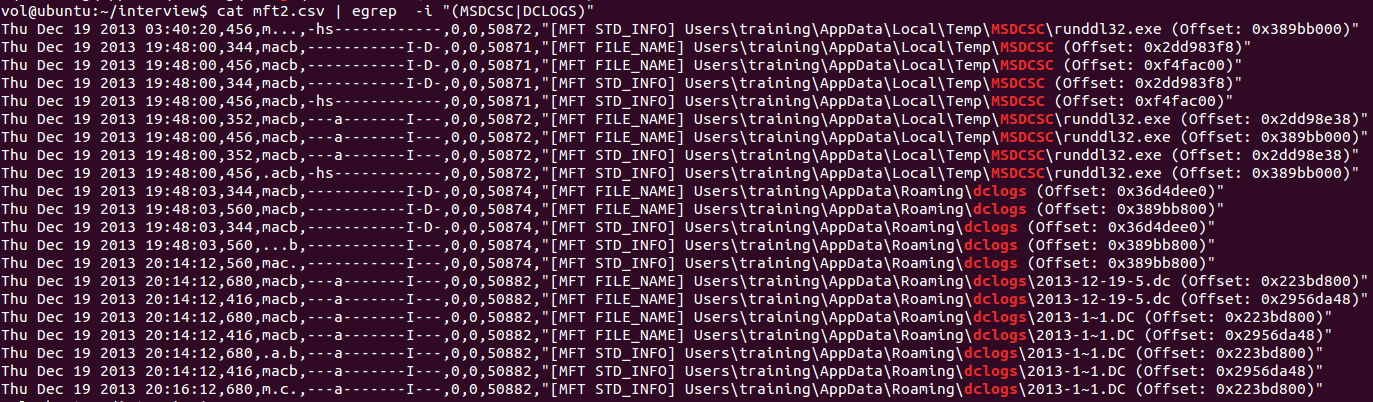
In my actual case I did a filescan to see if there was a file object open for the file in the dclogs directory. There was, so I used dumpfiles to extract it. With the file in hand it was easy to see all the keystrokes that were logged in that file.
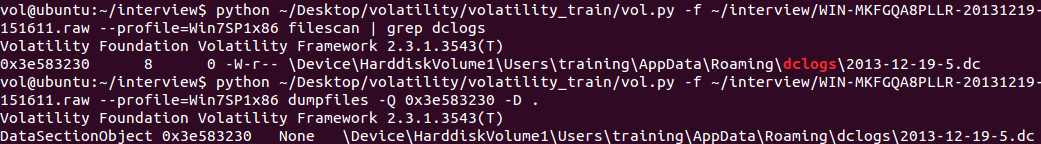
DarkComet logs keystrokes in a different file for each day. In all the testing and client work I have done, it seems that only the key log file for the day of the acquisition can be extracted as a full file from memory. The log for keystrokes by default are stored in a file named “dclogs\<Date>.dc”. This can be useful in finding the initial infection date, as the log files will have entries in the MFT (We’ll talk more on the timeline later). Within the log, the keystrokes and open windows are logged as seen below.
DarkComet commands
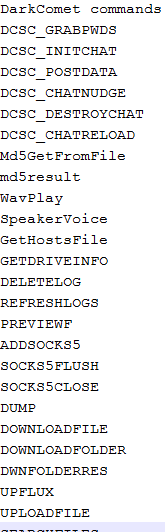
While looking through the strings in the memdump of the runddl32.exe process I also came across some commands that appear to be functions for DarkComet. This hints at some of the functionality. None of this is surprising though, as we have seen plenty or RATs that all have similar functionality.
Persistence
At this point in the investigation I had about answered everything I had wanted to in my actual investigation. I did not find any evidence that would suggest lateral movement occurred, but I did see plenty of evidence that suggest exfiltration did. My guess is that the exfiltration data was the keylogger logs, but I was not able to prove with the memory image alone. I did not run the ethscan plugin on this occasion, but that may have been able to pull a pcap of suspect traffic. The only remaining items I really wanted to answer were where the persistence key is stored and when did the infection take place.
Let’s check out the persistence first. We know what the key name is based on the configuration artifacts we pulled (MicroUpdate). We also know via research that there are only a few methods available to DarkComet via the builder for persistence. The standard Run key is used most commonly so it is probably the default. Thanks to the printkey plugin this should be a breeze.
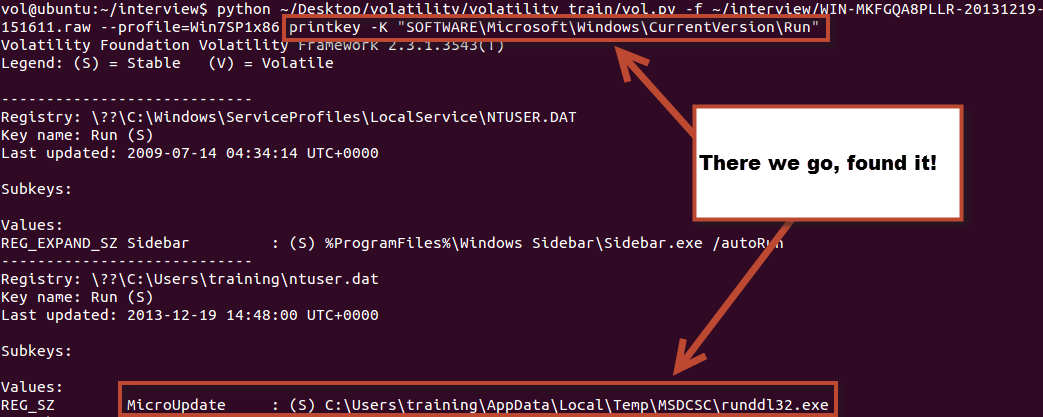
There we have it, a standard RUN key in the HKCU for the user that was logged on at the time of infection. With persistence understood, time to check out timeline related data.
Timeline
In the Volatility Class @gleeda goes over making a “Super Timeline” using time data in the memory. This is done not just with the timeliner plugin, but also by extracting out the registry and a few other techniques. In my actual case that was what I did, but for this demonstration the MFT plugin alone will suffice. Keep in mind that running timeline data can take a while, so what I like to do is run your general plugins like psxview, pstree, pslist, dlllist, netscan, handles, etc and output them to separate files, so you can cat and grep your way through them for analysis while the timeline is building.
python ~/Desktop/volatility/volatility_train/vol.py -f ~/interview/WIN-MKFGQA8PLLR-20131219-151611.raw --profile=Win7SP1x86 mftparser --output=body --output-file=mft.csv
mactime -b mft.csv -d -z UTC-5 > mft2.csv
When analyzing the timeline data, I start with what I already know and pivot from that data. In this case, I know about two directories and some files that are directly involved with this malware. So I will start by grepping that material and looking around the same time frames for other suspicious data.
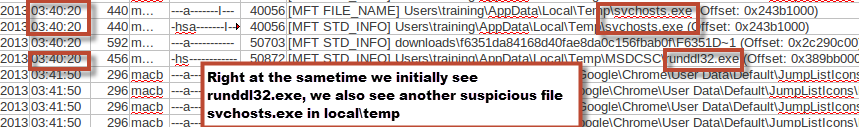
In this demonstration, svchosts.exe in the local temp directory stood out. Now that you have another file of interest you can do a lot of the same things we have already shown to extract it out and learn more about it. In a real case I am looking for what activity occurred right before, so I can understand what may have been the infection point. For instance if I saw a lot of browsing, than it may be a good idea to check out internet history, if I saw a prefetch file entry for java maybe I would look around for an idx file that could show me more. Additionally I am looking for other items that may indicate what the attacker has done once on the box. Here we see that there are key logs being stored, but in more advanced cases where an attacker manages to get a shell, we may see evidence of the tools the attacker was using. @jackcr had a recent post on this that goes into further details on that topic.
Wrap it up with Yara
I could really go into more details on other parts of this analysis but as this is already a very long article I should probably wrap it up. Part of the reason for writing this post is so that if others came across a DarkComet memory sample they could get to the data quicker than I did. To help along with this, the following Yara rules may prove useful:
rule DarkComet_Config_Artifacts_Memory
{
meta:
Description = "Looks for configuration artifacts from DarkComet. Works with memory dump and unpacked samples."
filetype = "MemoryDump"
Author = "Ian Ahl @TekDefese"
Date = "12-19-2013"
strings:
$s0 = "GENCODE={" ascii
$s1 = "MELT={" ascii
$s2 = "COMBOPATH={" ascii
$s3 = "NETDATA={" ascii
$s4 = "PERSINST={" ascii
condition:
2 of them
}
rule DarkComet_Default_Mutex_Memory
{
meta:
Description = "Looks for default DarkComet mutexs"
filetype = "MemoryDump"
Author = "Ian Ahl @TekDefese"
Date = "12-20-2013"
strings:
$s = "DC_MUTEX-" ascii nocase
condition:
any of them
}
rule DarkComet_Keylogs_Memory
{
meta:
Description = "Looks for key log artifacts"
filetype = "MemoryDump"
Author = "Ian Ahl @TekDefese"
Date = "12-20-2013"
strings:
$s0 = "[<-]"
$s1 = ":: Clipboard Change :"
$s2 = "[LEFT]"
$s4 = "[RIGHT]"
$s5 = "[UP]"
$s6 = "[DOWN]"
$s7 = "[DEL]"
$s8 = /::.{1,100}\(\d{1,2}:\d{1,2}:\d{1,2}\s\w{2}\)/
condition:
any of them
}
 News
News
Reader Comments (5)
Great analysis Ian! Keep up the good work.
Regards, Ion.
Thanks Ion, been liking the recent activity on your bog as well!
Hi, Ian,
I was trying to following along but psxview -A returned no such option. Could you give me some direction on how to make that flag work ?? Thanks
great post, thank you very much for this.
Hi Ian,
Great post. Thanks for walking through analyzing DarkComet using Volatility. It was really fun and I learnt a lot. Please come with more. Thanks also for making the Automater tool available.
Lakshmi N